

 World Cup 2026
Highlights

Match recap
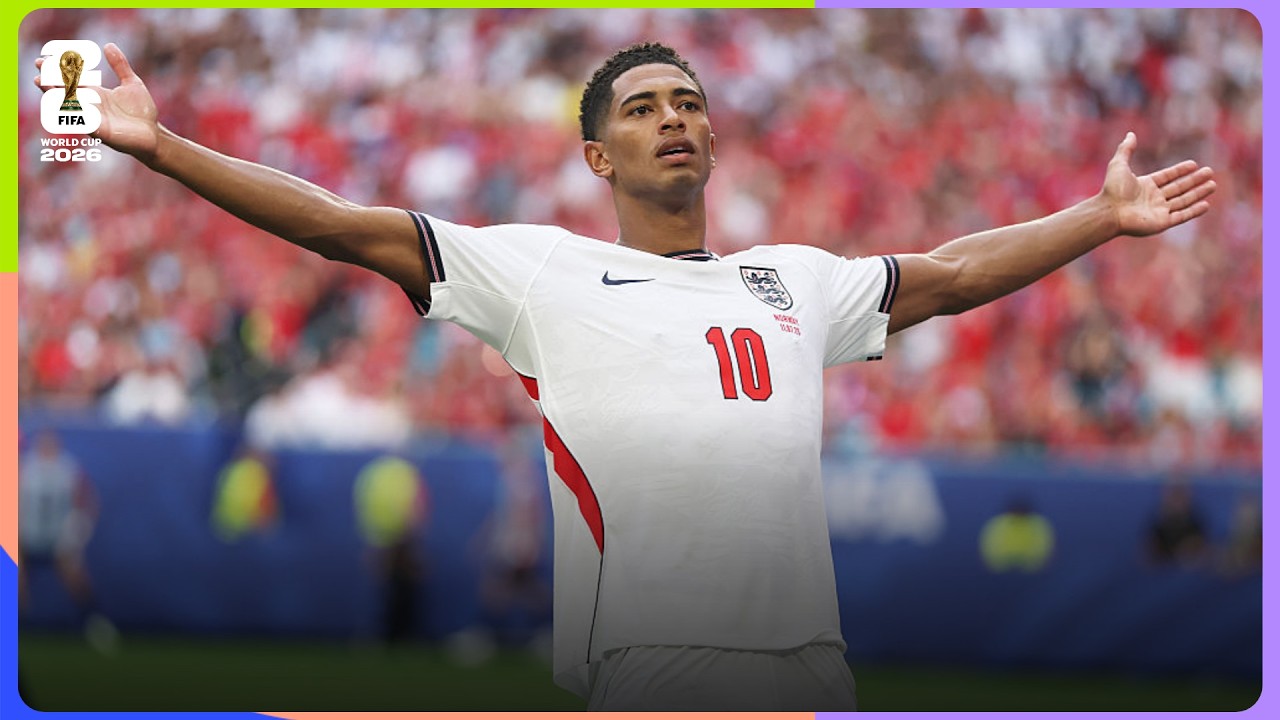
Jude Bellingham did what Jude Bellingham does. Norway led through Antonio Schjelderup's 36th-minute strike, built on a Martin Ødegaard assist, only for Bellingham to level it right on the stroke of halftime. Norway leaned almost entirely on their right flank (60% of attacking output) without ever threatening from it, while England spread the ball more evenly and let a central pocket — barely a fifth of their own output — do the real work, generating 0.87 expected goals and nine shots. That balance, more than any single stat, foreshadowed the eventual outcome even before extra time, where Bellingham struck again early to complete his brace and send England through. Norway's run at a first World Cup quarter-final in decades ends agonizingly, undone by the one player capable of deciding a game alone, twice, in the same match.
Match analysis
Key Events
Extra Time
Lineups


Key Stats
Shot Map
Pinch to zoomMatch Momentum
Expected Goals
Match Stats
Attack By Flanks · Match Analysis
Final-Third Entries
Where each team got the ball into the final third · Brighter = higher xG
NorwayEnglandFinal-third entries grouped by left / center / right channel. Zone brightness reflects xG (goal threat), not raw volume.
Territorial Control · Match Analysis
Zone Dominance
On-ball actions per zone · Brighter = higher share
27%
att. third
28%
att. third
Norway672England771Attack →
Attack →
On-ball actions (passes, carries, dribbles, shots) across six pitch zones. Top row = left channel, bottom row = right channel.
Pass Networks · Match Analysis
Passing Connections
Average positions · Node size = pass volume · Line width = pair frequency
Norway611 passesAttack →
England683 passesAttack →
Player positions averaged across all successful passes. Node size = passes attempted; line width = pair frequency.
Player Comparison Scatter · Match Analysis
NorwayEngland1 — 2