

 World Cup 2026

Highlights

Match recap
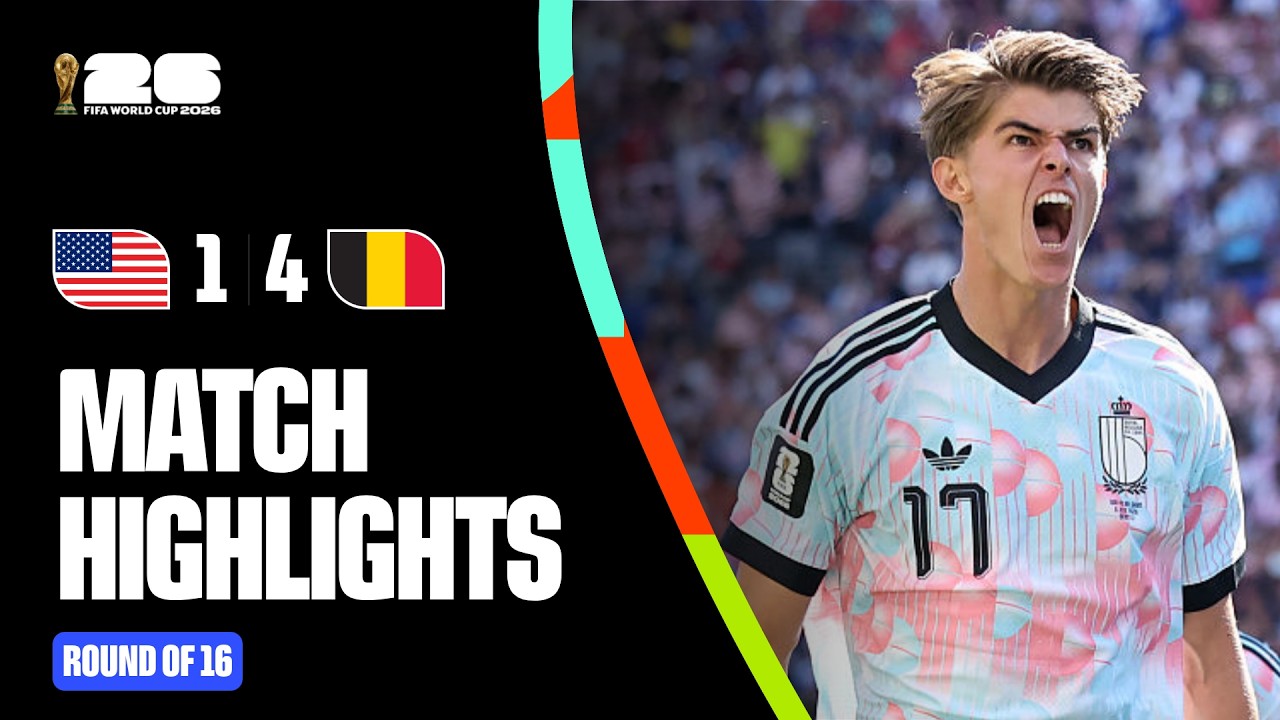
The co-hosts' tournament ended in comprehensive fashion. Charles De Ketelaere's early goal set the tone, and although Malik Tillman's 31st-minute equalizer briefly gave the home crowd hope, De Ketelaere restored the lead two minutes later and the USA never got closer. The USA actually shaded the general territorial numbers — more possession (56% to 44%) — and leaned heavily on their left flank (55% of attacking output), but that width barely created a chance (0.08 xG all game). Belgium's central patch, using only a sliver of their own output, was clinical by comparison: 2.02 expected goals and 12 shots from just 17 entries. Hans Vanaken added a third after the break, and Romelu Lukaku, off the bench, finished it in stoppage time. A big scoreline against the hosts, and a reminder that Belgium's golden generation still has teeth.
Match analysis
Key Events
Lineups


Key Stats


Shot Map
Pinch to zoomMatch Momentum
Expected Goals
Match Stats
Attack By Flanks · Match Analysis
Final-Third Entries
Where each team got the ball into the final third · Brighter = higher xG
USABelgiumFinal-third entries grouped by left / center / right channel. Zone brightness reflects xG (goal threat), not raw volume.
Territorial Control · Match Analysis
Zone Dominance
On-ball actions per zone · Brighter = higher share
22%
att. third
22%
att. third
USA639Belgium513Attack →
Attack →
On-ball actions (passes, carries, dribbles, shots) across six pitch zones. Top row = left channel, bottom row = right channel.
Pass Networks · Match Analysis
Passing Connections
Average positions · Node size = pass volume · Line width = pair frequency
USA565 passesAttack →
Belgium438 passesAttack →
Player positions averaged across all successful passes. Node size = passes attempted; line width = pair frequency.
Player Comparison Scatter · Match Analysis
USABelgium1 — 4